
Find it in Mynewsdesk: Analyze > Newsroom.
In your newsroom statistics, you will find summarized insights of your entire newsroom.
Date range – Select a specified time for the statistics you want to see. The entire page, as well as the reports and statistics to the right of the dropdown menu, will adjust to the selected period.
Share report – Share the report through a link. The one who receives the link does not have to be logged in to view the page.
Export statistics – Receive statistics of the selected period. This will be sent in Excel format via email.
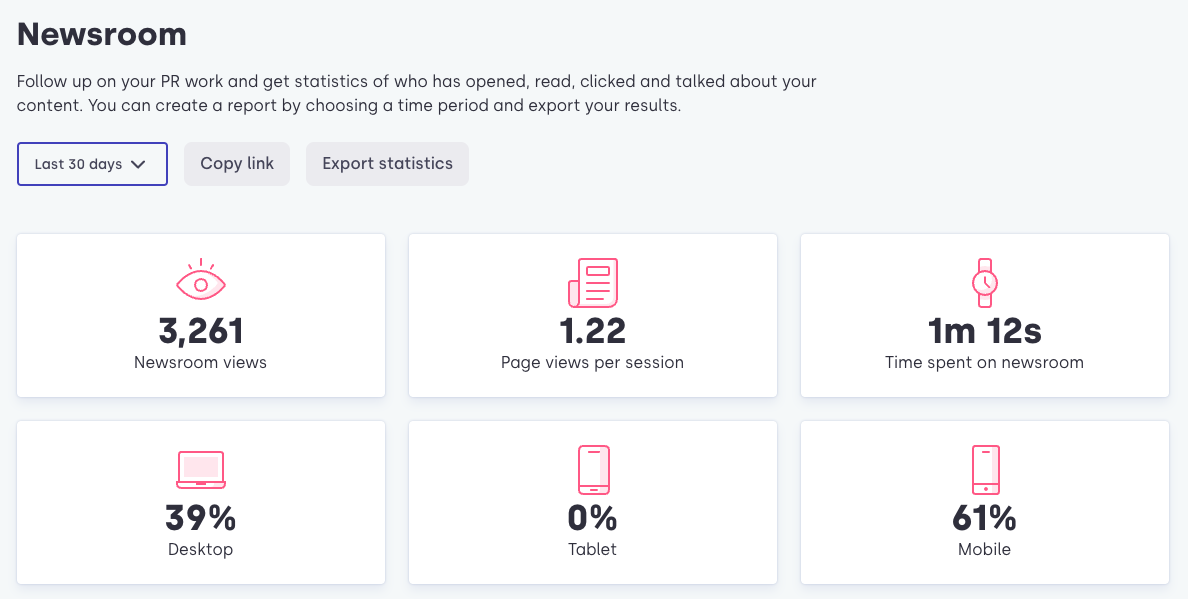
Newsroom views – The total number of web views gives you an indication of the performance of your newsroom.
Page views per session – This shows how many pages your average reader visits during a session in your newsroom. When creating your story, make sure to use relevant content in order for your reader to engage with your newsroom even more.
Time on site – This is the average time that your readers spend in your newsroom. If your readers find your stories interesting and relevant, there is a higher chance that they stay longer and actually read them.
Device – See what device your visitors are using when they are reading your stories. Do they use a big or small screen? If the number of mobile users is high, you could modify the content format by shortening the text or using more subheadings.
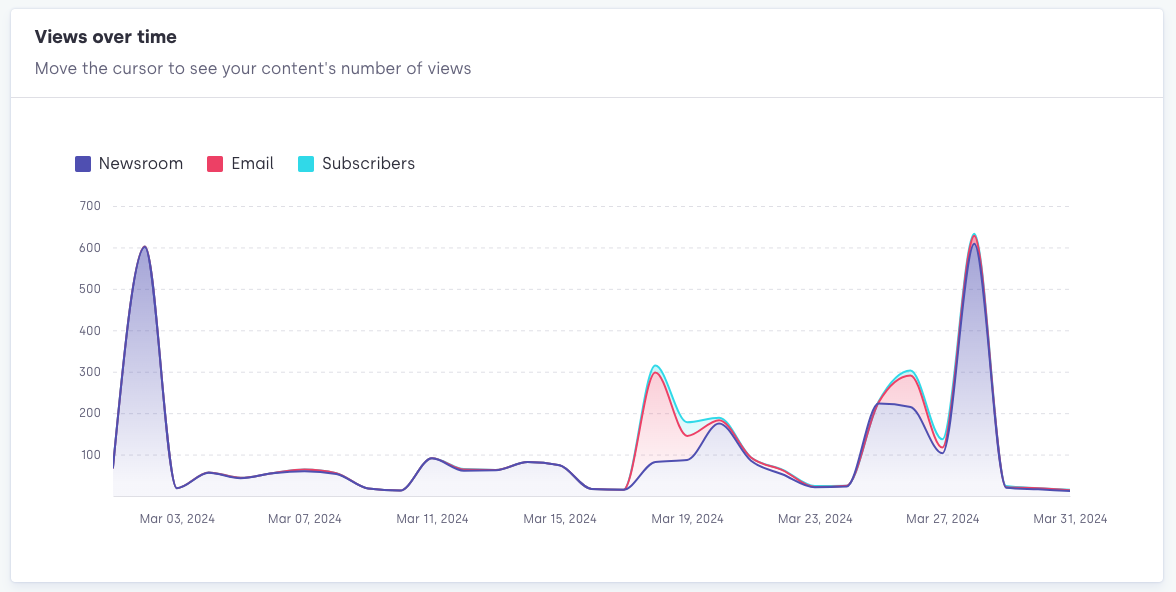
Views over time – The graph shows how many views you get per day from the web, emails and alerts. Hover the mouse over a specific day to see the details.

Your top stories – These are the most read stories during the date range you’ve chosen. If you click on a headline, you will arrive at the detailed statistics for that particular piece of content.

Traffic sources – Find out what sources your visitors come from. When you hover the mouse over a source, an information icon appears with info about that particular source. It’s important to know which sources visitors come from in order to gain knowledge and awareness of your audience.
Here are some explanations of common sources:
- Mynewsdesk – These are visitors who have clicked on a link somewhere on the Mynewsdesk site and were led to your story, i.e. from the story page or from some other page in the newsroom.
- Google – These are visitors who Googled their way into your story i.e. typing keywords that are included in your stories.
- Direct – These are visitors who have typed the URL directly into their browser, or clicked untagged links (links we can’t track i.e. links in text messages that lead straight into your story), bookmarks and links from documents.
- Newsletter – Theses are visitors who have found their way into your newsroom by clicking a link in an email sent from a newsletter service like Apsis or MailChimp.
- Mynewsdesk subscribers – These are visitors who have clicked on links from subscriber emails. Subscribers are those who create an account on Mynewsdesk and start subscribing to subjects, regions and keywords they are interested in. A subscriber receives an email (subscriber email) with content relating to what they have subscribed to.